library(palmerpenguins)
library(ggplot2)

g <- penguins |>
  ggplot(aes(x = bill_length_mm, y = bill_depth_mm)) +
  geom_point() +
  geom_smooth(method = "loess", formula = y ~ x)

g +
  facet_grid(cols = vars(species), margins = TRUE)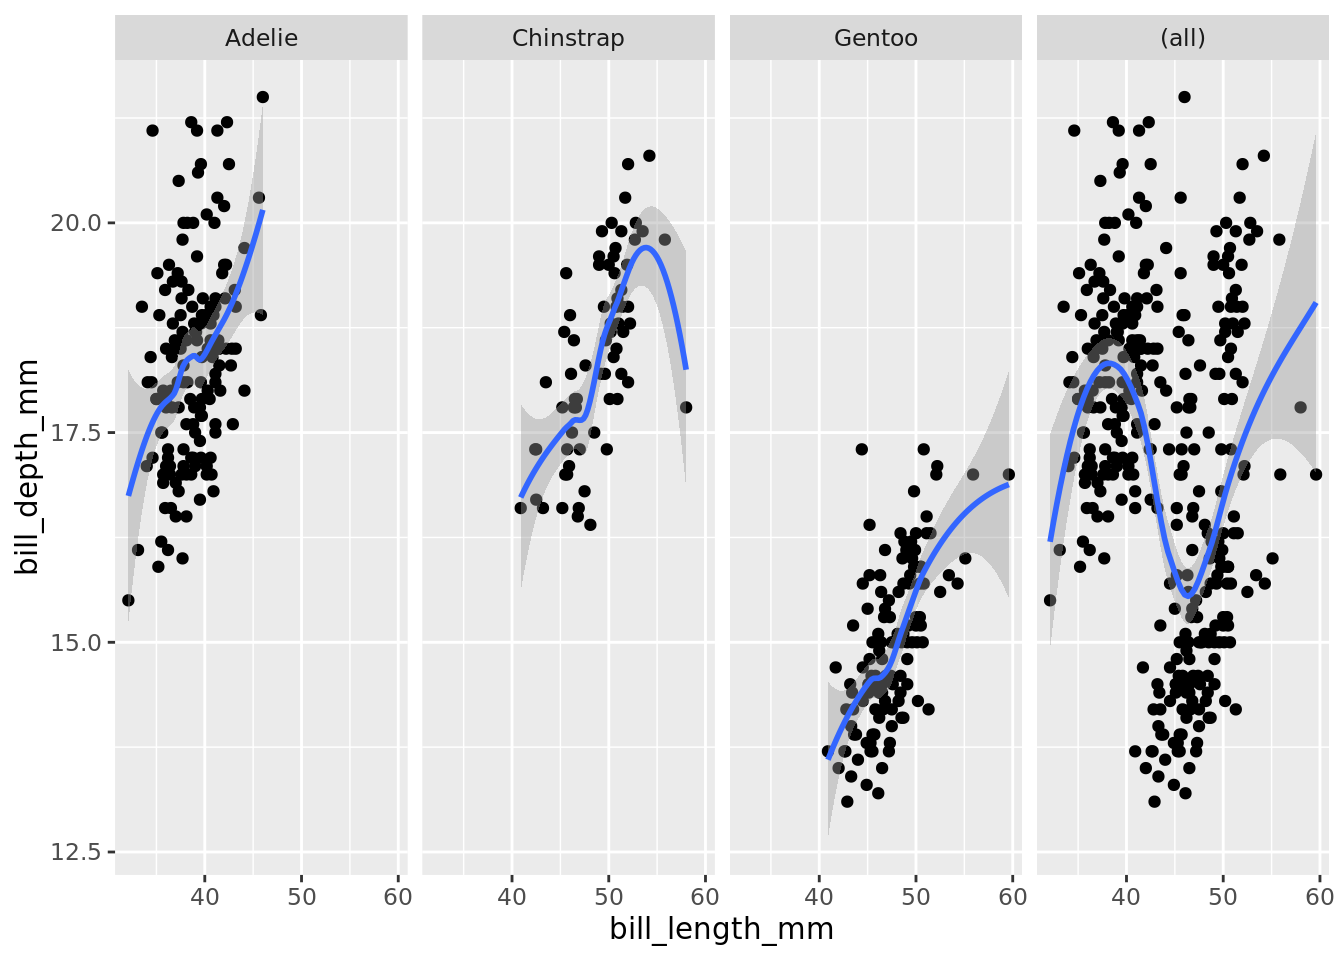
ggplotfacet_grid + margins
Sometimes you want to use facets (or small multiples) to show something about individual groups in the data - but if you want to also have a facet that represents the whole data, just set margins = TRUE in your facet_grid call1
library(palmerpenguins)
library(ggplot2)
g <- penguins |>
ggplot(aes(x = bill_length_mm, y = bill_depth_mm)) +
geom_point() +
geom_smooth(method = "loess", formula = y ~ x)
g +
facet_grid(cols = vars(species), margins = TRUE)
You might also want to change the “(all)” label, which you can do using a labeller function:
label_facets <- as_labeller(\(x) gsub("\\(all\\)", "Total", x))

g +
  facet_grid(cols = vars(species), margins = TRUE, labeller = label_facets)
You can also specify which variables you would like to add margins for with character variable names, instead of TRUE.↩︎